Gene Ontology Data
How do I find the GO annotations for my set of genes?
This assumes that you have successfully uploaded or created your set of genes. If you require help with this please see Lists
To find the GO term annotations for your genes it is easiest to start with a specially created template search:
- From the FlyMine homepage, select the ‘Templates’ tab from the navigation bar.
- From the list of templates we are looking for one called Gene → GO terms. If you cannot see it immediately enter ‘GO’ into the filter box to narrow the search.
- Click on the template name, this will display the template form. Enter the gene or select the list you wish to run the search with and press ‘Show results’.
Modifications:
This template search returns GO term annotations for all three GO ontologies along with other GO attributes, such as evidence code and qualifier. You may wish to further filter your results on some of these attributes, or add additional attributes to the search, such as annotation extension or the GO ‘with’ attribute. The following examples illustrate how to do this:
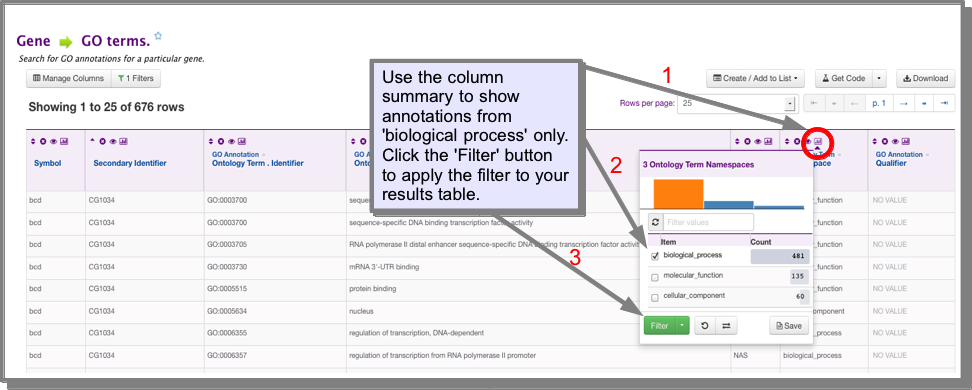
How do I filter my results to show only GO annotations from the ‘biological process’ ontology?
The easiest way to filter your results is using the filter functions in the results table. In the ontology term.Namespace column click on the column summary icon. Select ‘biological process’ and click filter. To return to your original results either remove the filter by clicking on the green ‘filter’ icon in this column header, or use the UNDO button above the results table:
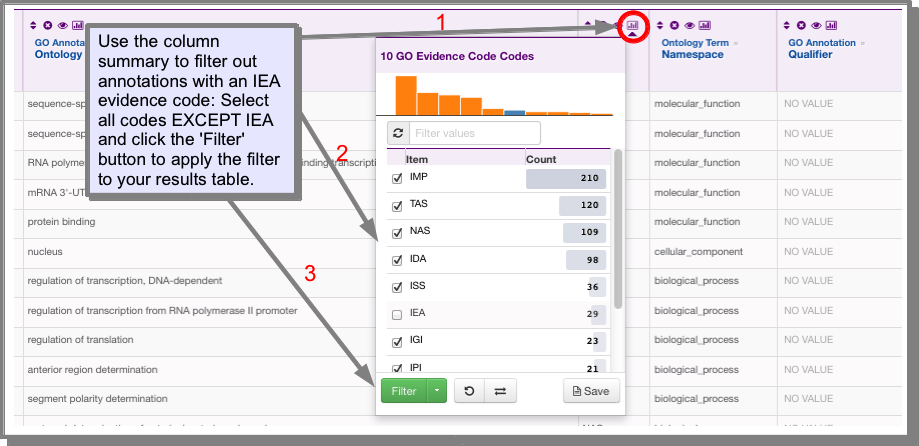
How do I filter my results to remove those with the IEA (inferred from electronic annotation)
evidence code?
You can do this either through the column summary or the filter’ function:
- Using the column summary:
Click on the column summary icon in the code column. Select all evidence codes except IEA and click filter.
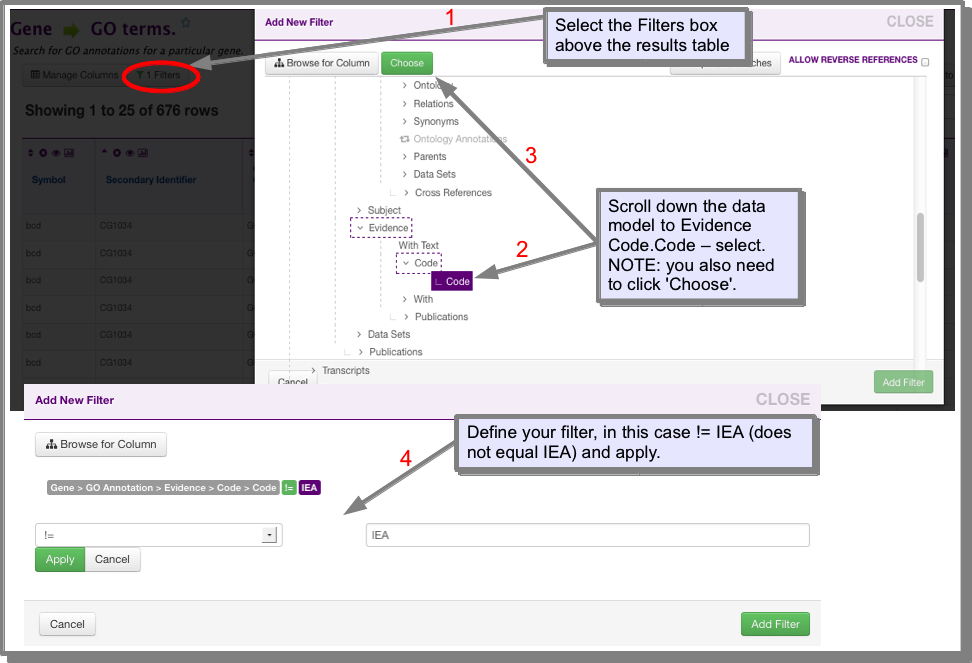
- Using the filter button:
Click on ‘Filters’ above the results table. Scroll down to the GO Evidence Code field and click ‘Choose’. Define your filter and click ‘Add filter:
How do I analyse my gene list for GO term enrichment?
Go term enrichment is calculated automatically for all gene lists - you simply have to navigate to the List analysis pages for your list. The GO term enrichment for your list will be displayed as a widget (see What is a widget?). For more information on the enrichment calculation see the InterMine documentation.
Other Gene Ontology searches
FlyMine includes many other Gene Ontology related searches. To see the full range of searches navigate to the Template Searches page and enter ‘GO’ into the filter box (see Finding the template search that you want). For example you can find all genes annotated to a particular GO term using the GOterm → Genes template. This search is extended by the template GO term name [and children of this term] → Genes in one specific organism, which will return genes annotated to the term given AND genes annotated to any children of this term. Various combinations of GO term and data searching are available, for example Gene → orthologues and GO terms of these orthologues, will return the GO terms annotated to the orthologues of your gene(s). Remember, if you don’t see what you are looking for please Contact Us - we can probably construct the search for you.
Expression Data
How do I find which tissues or developmental stages my gene(s) is/are expressed in?
For a single gene the quickest way to view the available expression data is to look at the Report Pages for that gene. Here you will find graphs showing the expression of the gene across development and the expression in adult fly tissues. In addition tables showing in situ mRNA expression data from BDGP and FlyFish are available.
For a list of genes, widgets (graphs) are available on the List analysis pages showing expression in adult fly tissues (FlyAtlas data) and across development (modENCODE RNA_seq data, BDGP and FlyFish in situ hybridisation).
How do I find genes expressed in a particular tissue or at a certain developmental stage?
A number of template searches are available to analyse the various sources of expression data. Due to the widely variant nature of the different expression sources, it is generally necessary to search each one separately - for example data for expression over development is available from BDGP, FlyFish, the modENCODE RNA_seq data and from the time course data published by Arbeitman et al. Although a template search is available to analyse the BDGP and FlyFish data together, the development stage ranges they used in their studies do not agree exactly.
The following templates searches specifically look for genes expressed at a particular developmental stage(s) or in a particular tissue(s):
Tissue [D. melanogaster] → FlyAtlas data (allows optional filtering on FlyAtlas values)
BDGP → Genes (searches for a specified expression term and developmental stage).
Stage [D. melanogaster] → FlyFish + BDGP in situ data
FlyFish expression term + stage [D. melanogaster] → Genes
To see all template searches for expression data navigate to the Template Searches and filter the list for ‘expression’ using the drop-down filter menu (see Finding the template search that you want).
How do I find genes expressed ONLY in a particular tissue?
This is a three step process:
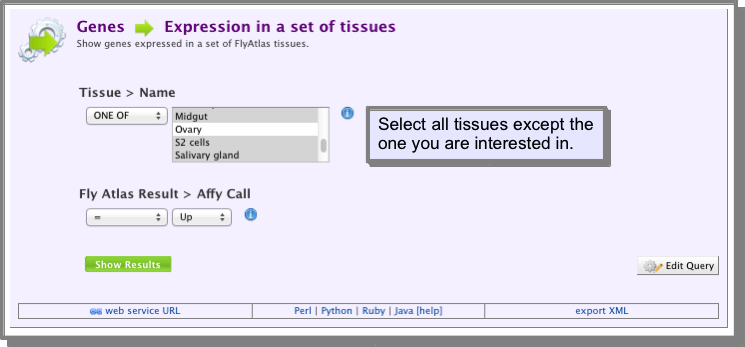
- Find and save the genes expressed in all tissues except the one you are interested in.
For this you can use the template Genes → Expression in a set of tissues. From the drop down list of tissues select all tissues except the one you want to find the tissue-specific genes. The operator should be set to ONE OF:
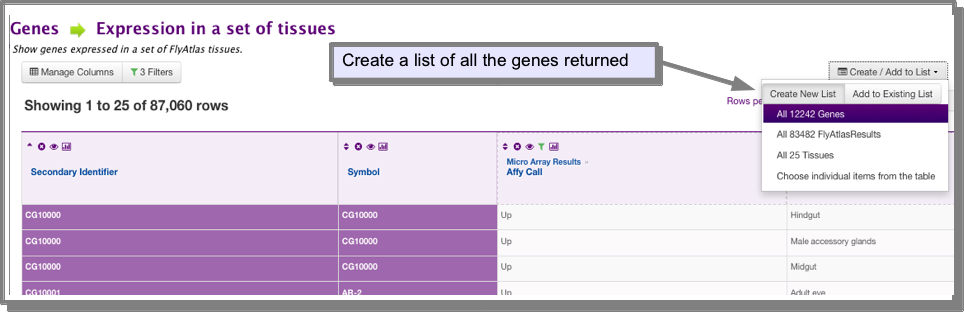
Create a list of all the genes returned by your search (If you are unsure how to save a list of genes see Save a results set for further analysis):
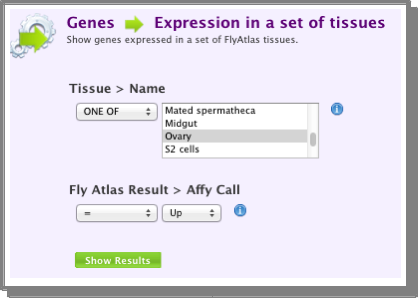
- Find the genes expressed in the tissue you are interested in:
You can use the same template as above - just change the tissue selection to the one you are interested in. Again, save the set of genes returned by the search:
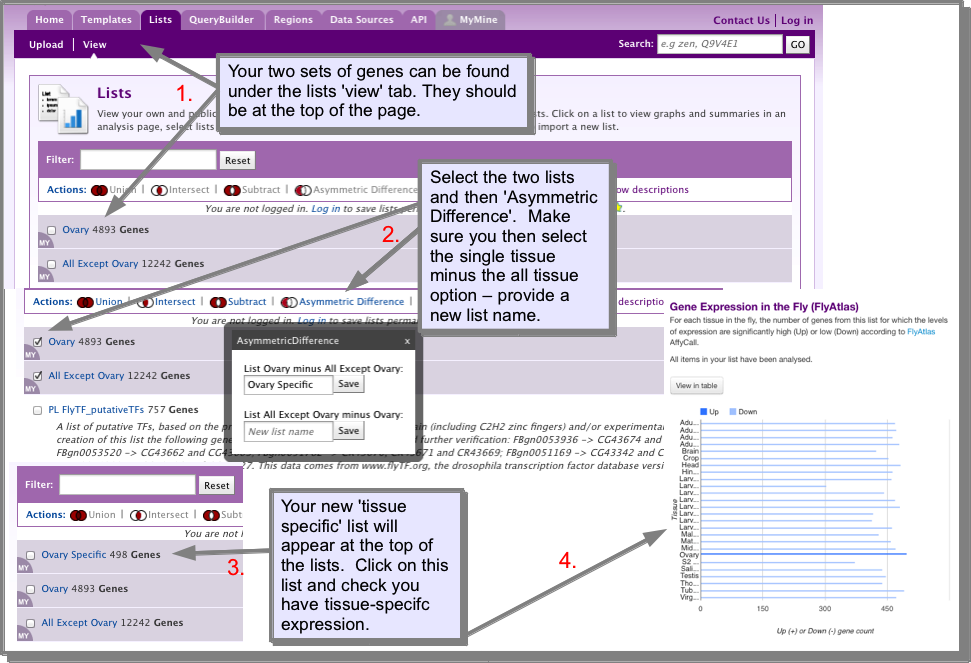
- Find the genes expressed ONLY in the tissue you are interested in:
Now to find the genes that are expressed ONLY in the tissue you are interested in you need to subtract the first list created above from the second list. To do this, navigate to the lists ‘view’ page. The two lists you have just created should be at the top of the list of lists. Select the two lists and then ‘Asymmetric Difference` (Note that you need to use Asymmetric difference rather than subtract - the icons on this page illustrate the difference between these two operations). The Asymmetric difference provides options to subtract the lists either way - you need to select the single tissue list minus the all but one list - enter a name for your new list. The new list should appear at the top of the lists view page. In this example, as we are using the FlyAtlas data, we can check that we have created a tissue-specific expression set by looking at the FlyAtlas widget on the List analysis pages for the list we have just created.
- Similar searches.
The same workflow can of course be applied to finding other unique sets - for example, genes expressed only in a particular developmental stage. The template search RNA_seq → genes expressed in a set of tissues can be used to create various lists based on the modENCODE RNA_seq data (which includes developmental stage, tissues and other conditions).
Pathways
Where does the pathway data come from?
In FlyMine we load pathway data from both Reactome and KEGG . However, note that the KEGG data has not been updated since May 2011 due the current KEGG licensing requirement.
How do I find which pathways my gene(s) is/are involved in?
Use the following template search:
My gene is in pathway X, how can I find other genes involved in this pathway?
Use the following template search:
I am not sure of the exact name of the pathway, how can I find this?
Just start typing in the pathway name box - the type-ahead function will automatically show you matching pathways.
Can I visualize this pathway data in InterMine?
We do not currently have any pathway visualization within FlyMine. However, linkouts enable you to view the pathways in either Reactome or Kegg.
How do I find out if my genes or lists of genes have any pathways in common?
The underlying data model makes it possible to construct queries which effectively compare two lists for a specified attribute. Such a query is available as a template for comparing the pathways for two genes or two sets of genes. For two genes the query will return any pathways that are shared by the two genes. Similarly, if two lists are provided any pathways shared between any two genes in the lists are returned. The template is:
additional pathways?
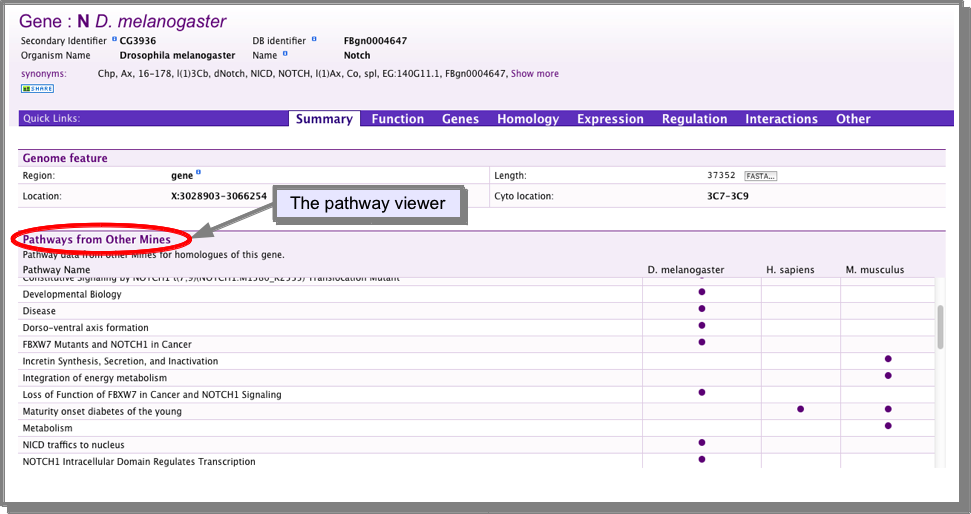
For a single gene, use the report page pathways viewer:
Each gene report page in FlyMine (and in other MOD-InterMines) includes a table displaying pathways for the orthologues of the gene you are viewing. The table is created by searching the other InterMine databases for orthologous genes and the pathways they are involved in:
For a list of genes:
- Send your list of genes to the relevant organisms Mine:
see Open another organisms MOD-intermine via the orthologues of your list
- Once in the other Mine, search the templates for a search that will provide you with the pathway data for your genes.
- At present we do not have a tool that will directly compare the pathways for your list of genes. However if you download your pathway list (see Download a set of results) and upload it back into your original mine (see Upload a list) you can use the List Set operations: to carry out an intersection on the two pathway lists.
Regulatory data
How do I find which transcription factors have been shown to regulate my gene(s)?
The following template will return all types of regulatory region that have been mapped for your gene:
For a specific type of regulatory region you can Apply a filter to your results. The fifth column of the results (sequence ontology term.name) provides the type of regulatory region.
The following template searches specifically for transcription factor binding sites and gives the factor which binds the site:
Can I create a list of other genes known to be regulated by this/these transcription factors?
Yes, use the following template:
TranscriptionFactor → Genes which have binding sites for this factor
How do I find the sequence of the binding sites?
- The templates Gene → Regulatory elements
- and Gene → Transcription Factors both include the sequence of the binding site in their results. For other templates you can add the sequence field if necessary (see Manage columns: Adding additional columns of data to your results). You need to look for the class Sequence and add the field called Residues.
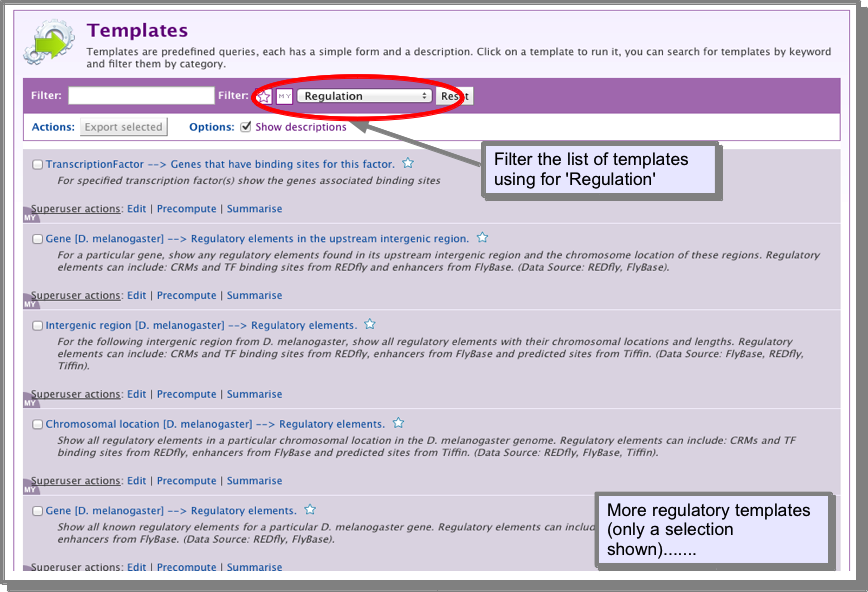
Other regulatory region searches
FlyMine includes many other templates for searching regulatory data, including searching within a specified chromosomal region and searching within gene flanking regions. To view all regulatory templates, go to the templates page and filter the list for Regulation:
Orthologues
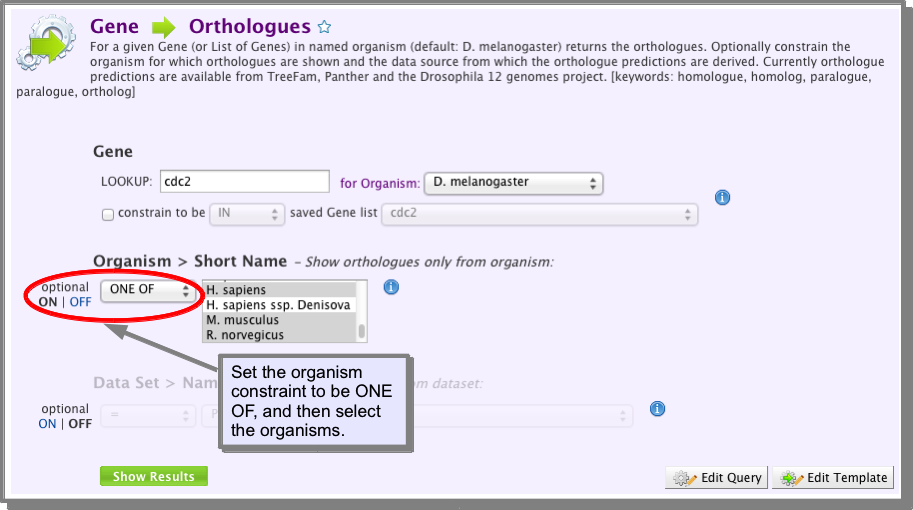
Do(es) my gene(s) have orthologues in Human, mouse or rat?
- Open the following template:
- Select the gene or gene list you wish to run the search on.
- Turn on the Organism Short Name constraint and select ONE OF and then select Human, Mouse and Rat (see image below).
- Run the template.
Does my gene(s) have a human orthologue associated with a disease?
In FlyMine we load disease and associated human gene data from OMIM . This data can be searched with orthologous fly genes using the following template:
Gene → Human disease gene and OMIM disease
You can also search genes associated with a specific disease. Two template searches are available, one that just returns Human genes and one that returns the Human genes and their orthologues either in all organisms or a specified organism:
- Return just the human genes:
- Return the Human gene and orthologues:
How do I export the sequences of an orthologous pair so that I can do an alignment in
galaxy?
- Run a template search to bring back the sequence of the gene and orthologous gene:
- Download the sequence to galaxy. You need to do this in two steps - once for the gene sequence and then for the orthologue sequence (you can’t download two sequences at once to galaxy). At this point, you need to ensure you have only one row of sequence as all rows will be downloaded. This can be achieved by further filtering your results (see Apply a filter to your results).
- In the download box, select FASTA sequence from the format options.
- Selecting the fasta option, provides a nodes option, where you can select which sequence column you are exporting.
- Under the output option you can optionally extend the sequence
- Under the destination option select Send to galaxy for analysis.
(see Send results to galaxy for more details).
- In galaxy you will need to cat your two sequence files. You can use the Concatenate datasets program under Text Manipulation in the menu bar.
- You can then use the ClustalW program in galaxy (available under Mulitple Alignments in the menu bar) to align your sequences.
Interactions
Do you load genetic and physical interaction data?
In FlyMine we load both genetic and physical (protein-protein) interaction data. Genetic and physical interactions are loaded from BioGrid. Physical interactions are also loaded from IntAct. Note that there is significant overlap in the physical interactions loaded from BioGrid and IntAct.
NOTE: All protein-protein interactions have been mapped to genes, so whether you are building your own search or using the template searches you will need to start from the Gene class and use gene identifiers rather than protein identifiers.
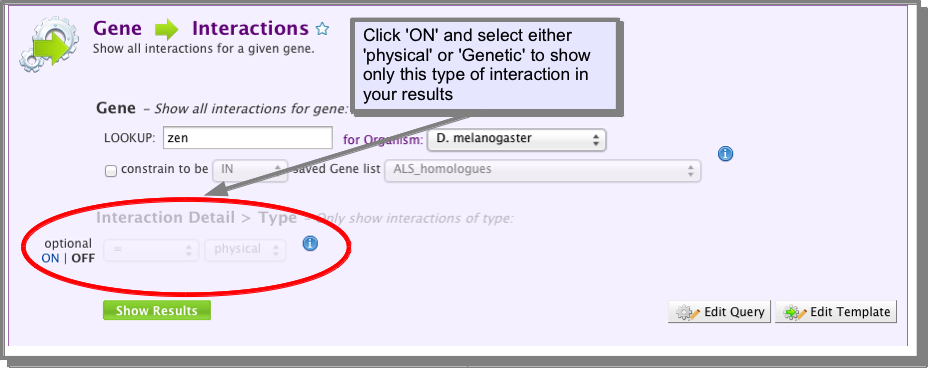
I am only interested in physical interactions, how do I filter out the genetic interactions?
A. Using a template search ‘’’’’’’’’’’’’’’’’’’’’’’’’’’’’’’’’’’’’’’’’’’’’’’’’’’
All of the interaction template searches in FlyMine include an optional constraint to show either physical or genetic interactions. Unless noted specifically, all interactions are shown by default:
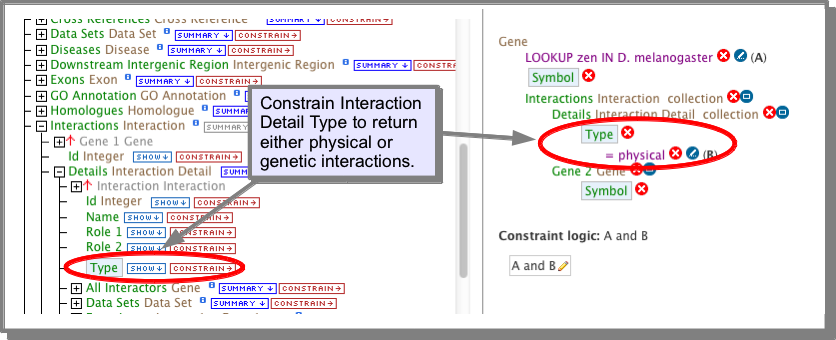
B. building your own query: ‘’’’’’’’’’’’’’’’’’’’’’’’’’’’’’’’’’’’’’’’’’’’’’’’’’’’’’’’’’
The Interactions class references a Details class which has a type attribute (field). This attribute holds the value physical or genetic. If you are building your own query (see The Query Builder), you can constrain this attribute to the required value:
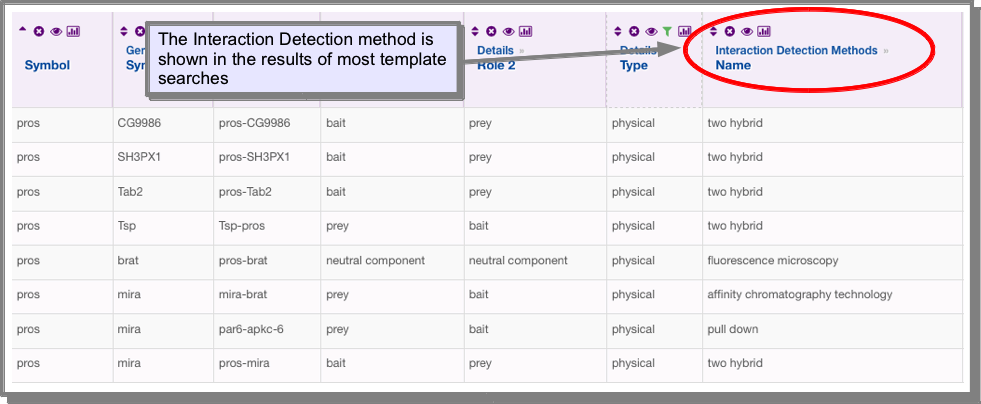
How do I find the experimental procedure that was used to predict the interactions?
The experimental procedure is stored in the Interaction Detection Methods under the attribute Name. This attribute has already been added to the results of the interaction templates:
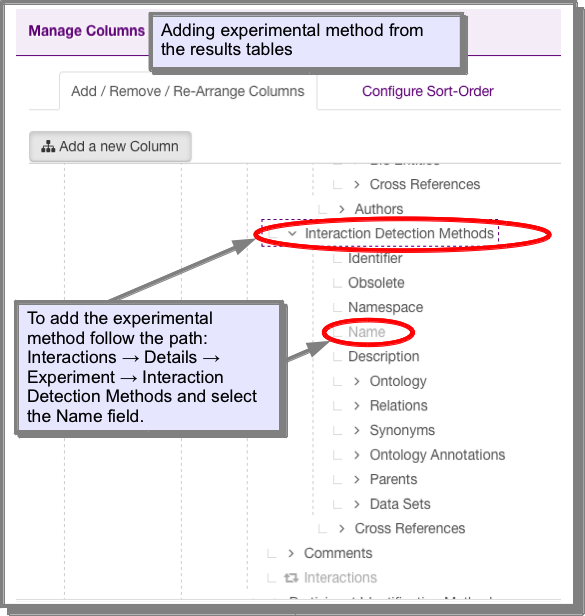
However, if you find one which has this attribute missing or you wish to add it to your own query, you can add it using the manage columns function on the results tables (see Manage columns: Adding additional columns of data to your results):
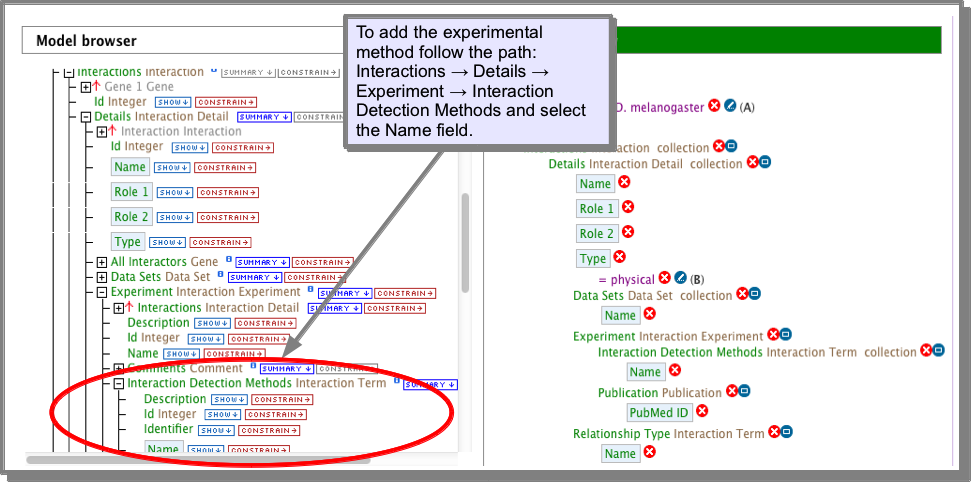
OR, using the query builder:
I am only interested in high-confidence interactions, how do I find these?
Currently the only way to filter out high-throughput or lower confidence interactions is to filter on the experimental method - for example you may want to exclude all interactions from two-hybrid studies. See How do I find the experimental procedure that was used to predict the interactions? and Column Summaries and Apply a filter to your results.
Coming soon: high-confidence interaction sets as assigned by IntAct.
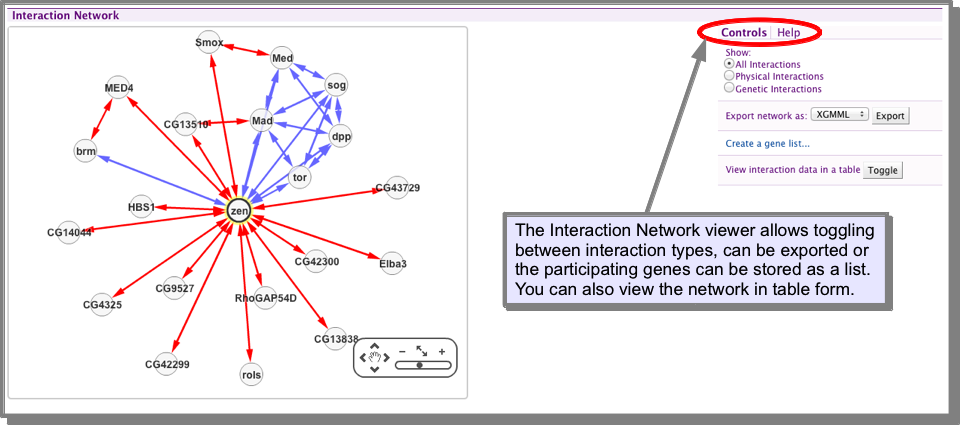
How do I view the interactions for my gene/protein?
The gene Report Pages include an interactions viewer. This allows you to toggle between showing all interactions, physical or genetic interactions, export your interaction network or save the list of participating genes as a list. You can also view the network in results table form, allowing further filtering and exploration (see Results Tables).
How do I find orthologues for my interacting genes/proteins?
The following template search will return the orthologues for interactions for a specified gene or gene list:
Gene→ Interacting Genes + Orthologues
You can also search on a genome scale using the following template:
All interacting genes in organism1 → Orthologues in organism2
Do the orthologues for my interacting genes also interact? (interologues).
This search can be carried out on a genome scale using the following template:
Interactions in organism1 → Orthologues that also interact in organism2 (Interologues)
Note that this template is dependent on the interaction sets loaded into the InterMine, so for FlyMine can only be run with worm (C. elegans) and yeast (S. cerevisiae).
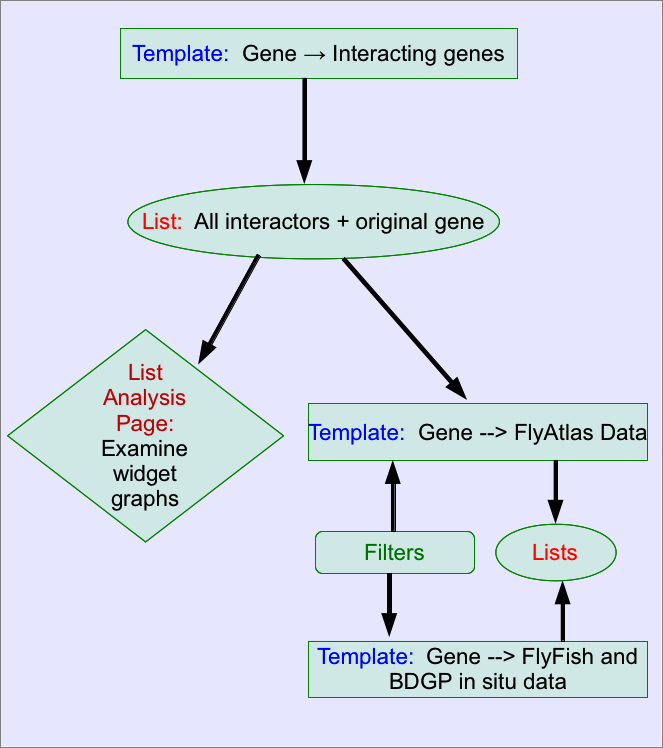
How do I find out if my interacting genes/proteins are expressed in the same tissue/dev stage? ——————————————————————————————————————–
- Run the following template to retrieve your interacting genes:
- Create a list containing all the interacting genes and your original gene. (You will need to create a list of the interacting genes and then add your original gene to this list - see Save a results set for further analysis for more information on creating lists from results tables).
- There are now several options to examine the expression of this set of genes. :
- The list analysis page:
The List analysis pages provides several graphical displays of expression data - tissue expression from FlyAtlas and developmental stage expression from BDGP and Fly-Fish. for the genes expressed in a particular tissue or stage, simply click on the bar, from where you can either create a list or view the genes in a results table - here you will easily be able to find whether your original gene is included in the set.
The above is a more exploratory approach to looking at the expression as you cannot see which sets include your original gene. For a more detailed analysis use one the templates described below:
B. Tissue-expression template: Run the following template with your list of genes:
- Filter the gene symbol column for your original gene. This will show you the tissues that your original gene is expressed in.
- Select the tissue you are interested in using the column summary and turn off the gene filter you applied above for your original gene. This will show you all the genes (and your original gene) that are expressed in that tissue. You could make lists of the genes expressed in each tissue for further analysis.
- Developmental stage expression:
The following templates will allow you to analyse your list for developmental stage expression. The BDGP and FlyFish data is in situ mRNA expression data, while the microarray time course data is a developmental stage microarray expression study by Arbeitman et al. Filter the data as described above to find stages in which your original gene and its interactors are expressed:
Gene → FlyFish and BDGP insitu data
You can examine the FlyFish and BDGP data separately if you wish:
Gene → Microarray time course expression data
The above workflow is summarised in the following diagram: