Interactions
Do you load genetic and physical interaction data?
In FlyMine we load both genetic and physical (protein-protein) interaction data. Genetic and physical interactions are loaded from BioGrid. Physical interactions are also loaded from IntAct. Note that there is significant overlap in the physical interactions loaded from BioGrid and IntAct.
NOTE: All protein-protein interactions have been mapped to genes, so whether you are building your own search or using the template searches you will need to start from the Gene class and use gene identifiers rather than protein identifiers.
I am only interested in physical interactions, how do I filter out the genetic interactions?
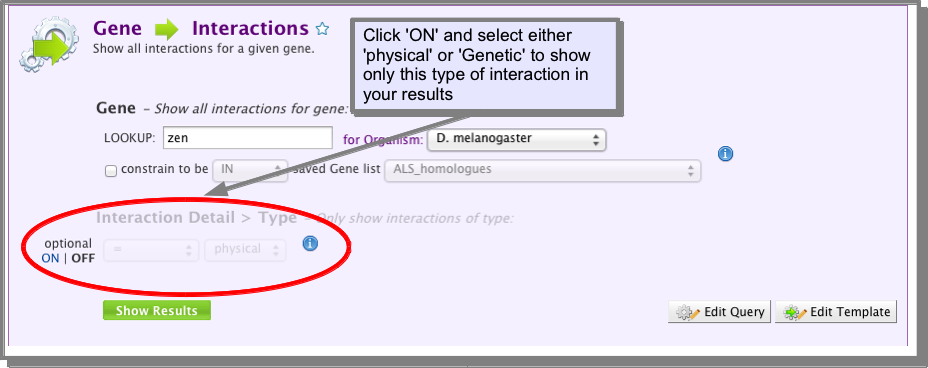
A. Using a template search
All of the interaction template searches in FlyMine include an optional constraint to show either physical or genetic interactions. Unless noted specifically, all interactions are shown by default:
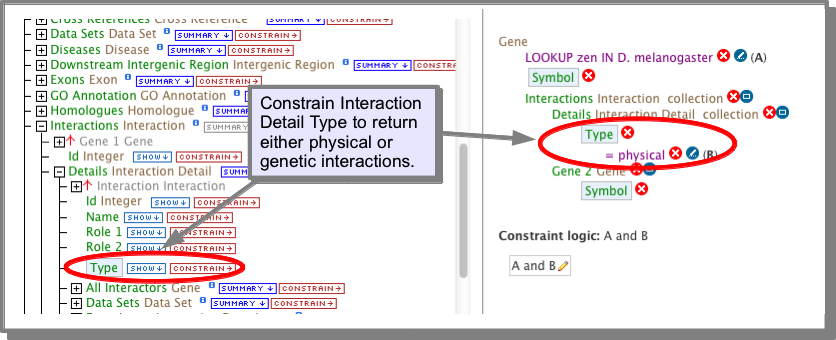
B. building your own query
The Interactions class references a Details class which has a type attribute (field). This attribute holds the value physical or genetic. If you are building your own query (see The Query Builder), you can constrain this attribute to the required value:
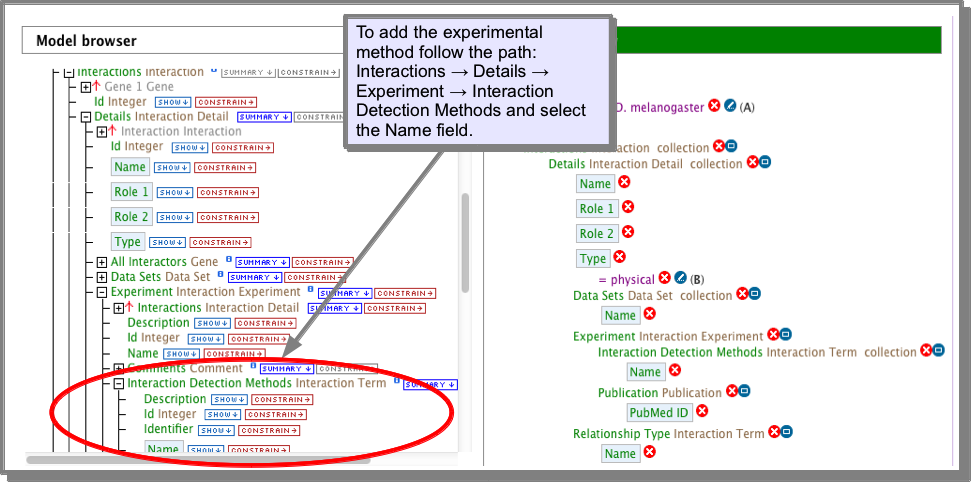
How do I find the experimental procedure that was used to predict the interactions?
The experimental procedure is stored in the Interaction Detection Methods under the attribute Name. This attribute has already been added to the results of the interaction templates:
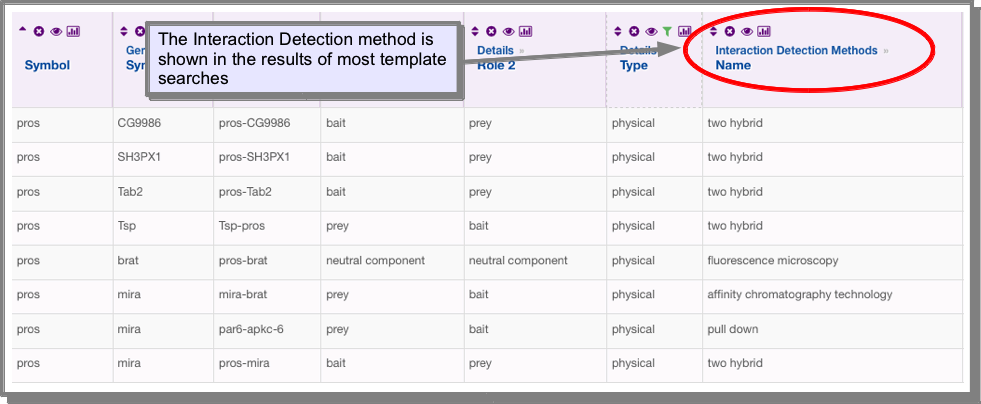
However, if you find one which has this attribute missing or you wish to add it to your own query, you can add it using the manage columns function on the results tables (see Manage columns: Adding additional columns of data to your results):
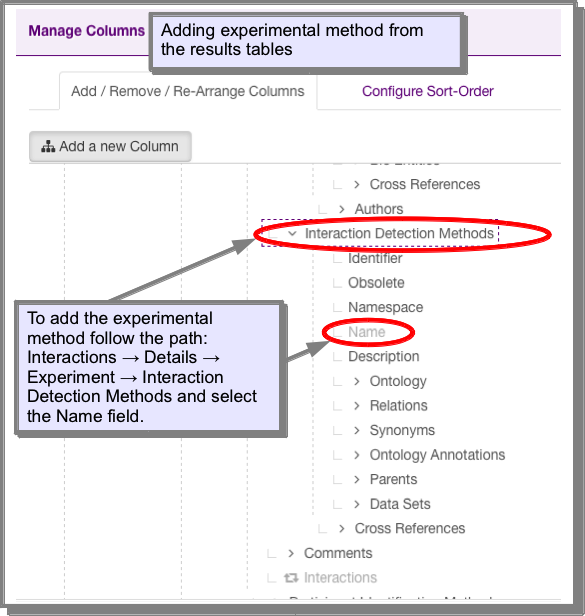
OR, using the query builder:
I am only interested in high-confidence interactions, how do I find these?
Currently the only way to filter out high-throughput or lower confidence interactions is to filter on the experimental method - for example you may want to exclude all interactions from two-hybrid studies. See interactionexperiment and Column Summaries and Apply a filter to your results.
Coming soon: high-confidence interaction sets as assigned by IntAct.
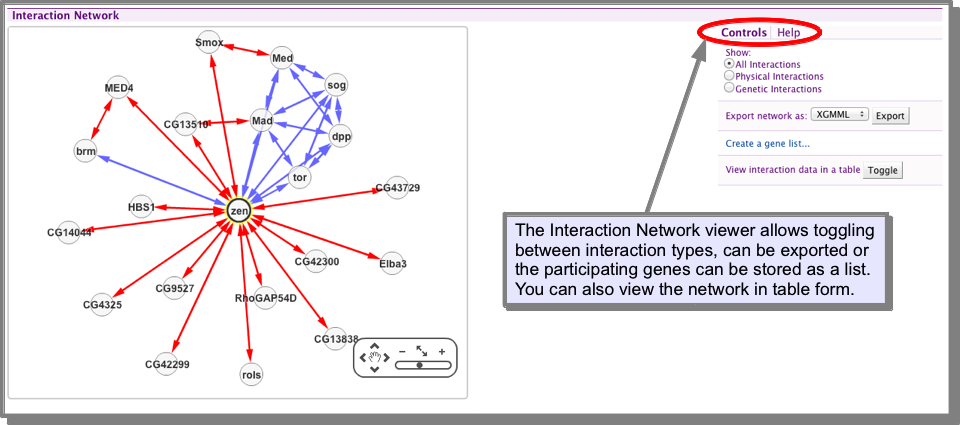
How do I view the interactions for my gene/protein?
The gene Report Pages include an interactions viewer. This allows you to toggle between showing all interactions, physical or genetic interactions, export your interaction network or save the list of participating genes as a list. You can also view the network in results table form, allowing further filtering and exploration (see Results Tables).
How do I find orthologues for my interacting genes/proteins?
The following template search will return the orthologues for interactions for a specified gene or gene list:
Gene→ Interacting Genes + Orthologues
You can also search on a genome scale using the following template:
All interacting genes in organism1 → Orthologues in organism2
Do the orthologues for my interacting genes also interact? (interologues).
This search can be carried out on a genome scale using the following template:
Interactions in organism1 → Orthologues that also interact in organism2 (Interologues)
Note that this template is dependent on the interaction sets loaded into the InterMine, so for FlyMine can only be run with worm (C. elegans) and yeast (S. cerevisiae).
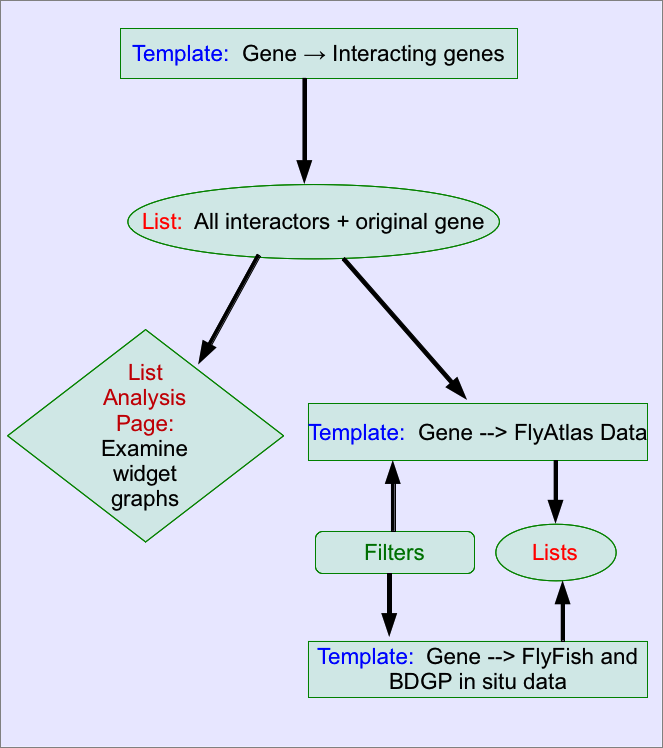
Are my interacting genes/proteins expressed in the same tissue/dev stage?
- Run the following template to retrieve your interacting genes:
- Create a list containing all the interacting genes and your original gene. (You will need to create a list of the interacting genes and then add your original gene to this list - see Save a results set for further analysis for more information on creating lists from results tables).
- There are now several options to examine the expression of this set of genes. :
- The list analysis page:
The List analysis pages provides several graphical displays of expression data - tissue expression from FlyAtlas and developmental stage expression from BDGP and Fly-Fish. for the genes expressed in a particular tissue or stage, simply click on the bar, from where you can either create a list or view the genes in a results table - here you will easily be able to find whether your original gene is included in the set.
The above is a more exploratory approach to looking at the expression as you cannot see which sets include your original gene. For a more detailed analysis use one the templates described below:
- Tissue-expression template:
Run the following template with your list of genes:
- Filter the gene symbol column for your original gene. This will show you the tissues that your original gene is expressed in.
- Select the tissue you are interested in using the column summary and turn off the gene filter you applied above for your original gene. This will show you all the genes (and your original gene) that are expressed in that tissue. You could make lists of the genes expressed in each tissue for further analysis.
- Developmental stage expression:
The following templates will allow you to analyse your list for developmental stage expression. The BDGP and FlyFish data is in situ mRNA expression data, while the microarray time course data is a developmental stage microarray expression study by Arbeitman et al. Filter the data as described above to find stages in which your original gene and its interactors are expressed:
Gene → FlyFish and BDGP insitu data
You can examine the FlyFish and BDGP data separately if you wish:
Gene → Microarray time course expression data
The above workflow is summarised in the following diagram: